Strength - Density
Class level
Metals and alloys
Ceramics
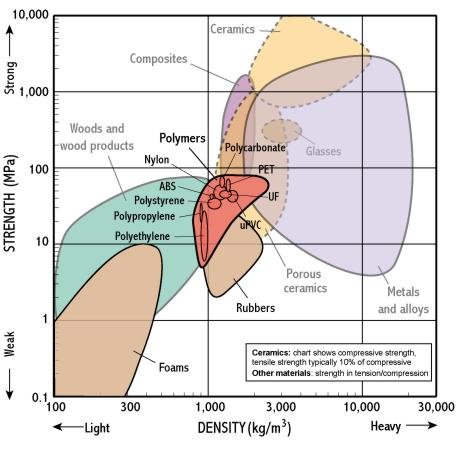
Polymers
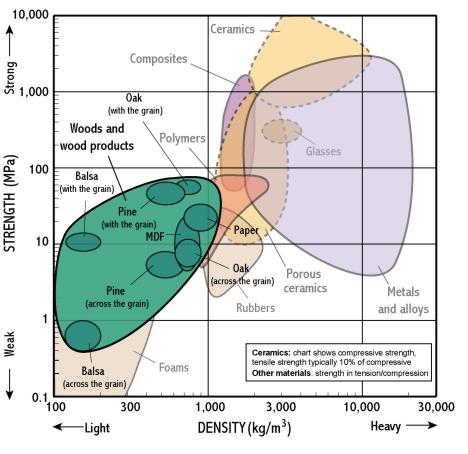
Wood and wood products
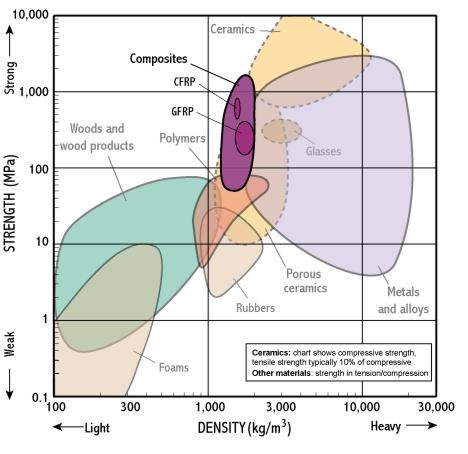
Composites
General Information
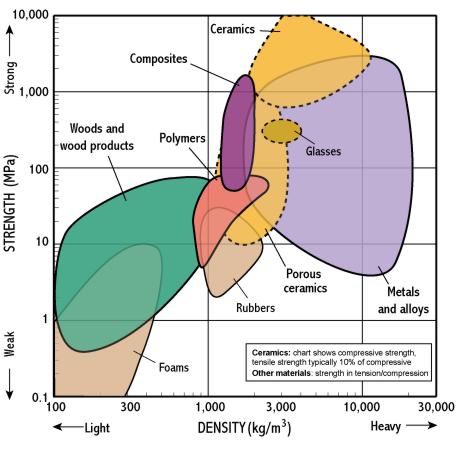
- Strength measures the resistance of a material to failure, given by the applied stress (or load per unit area)
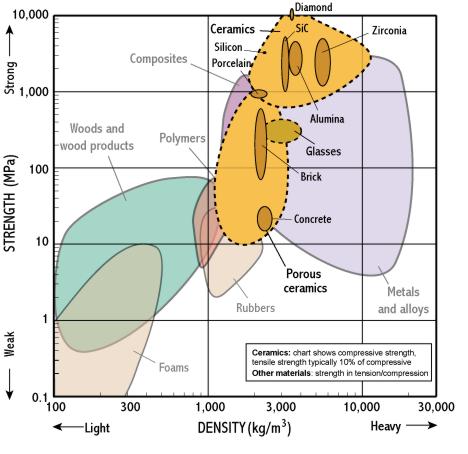
- The chart shows yield strength in tension for all materials, except for ceramics for which compressive strength is shown (their tensile strength being much lower)
- This chart is useful for identifying materials for components which require high strength combined with low weight (top left)
- Most polymers have densities slightly greater than 1 (just sink), most woods slightly less than 1 (just float)
- High strength at low weight is so often important that a property called specific strength is defined as strength/density
Physical Insights
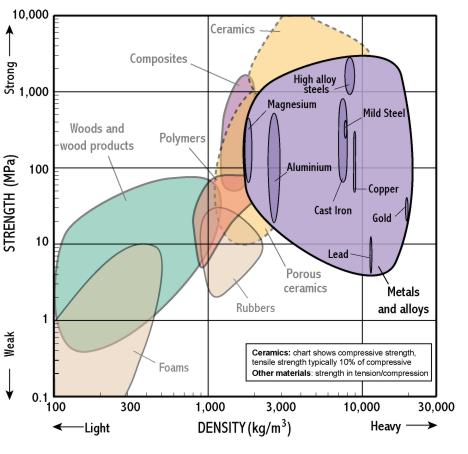
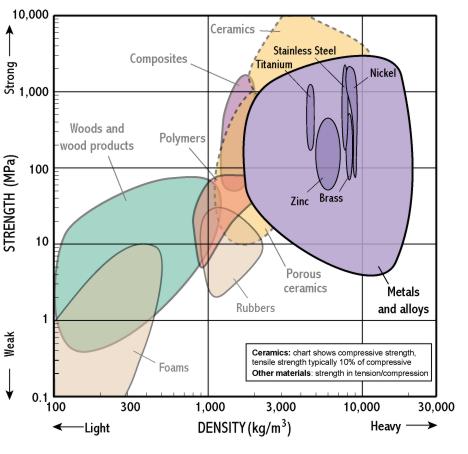
- The bubbles are elongated along the strength axis, but not density. This is because alloying and heat treatments have a strong effect on strength but little on density
- Strength is correlated to density so that most materials lie on the bottom left-top right diagonal
- Composites provide a means of achieving high strength at low weight because they exploit very strong fibres in light matrices
- Woods are somewhat like polymer foams having pores full of air and so float in water.
- Wood achieves high strength at low density by its efficient cellular microstructure
Example Uses
- Hang gliders tend to be constructed from light and strong materials (metal tubes with nylon or similar coverings).
- Zimmer frames often use aluminium tubes for low weight
Simple Questions
- Many aluminium alloys are heat treatable – what does this mean and how is strength affected?
- Select materials for a rucksack.
- Select materials for a car wheel.
Further Questions
- Why are forged alloy components often stronger than cast ones?
- Explain at a molecular level why low density polythene has a lower density than high density polythene
There are 2 separate populations for this class to improve clarity. Move the mouse over different parts of the class name to reveal each one.
Select chart:


