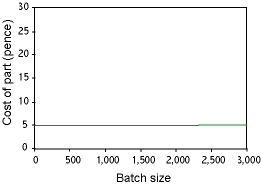
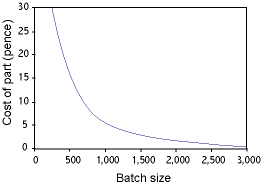
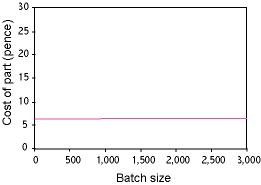
So how can we go about estimating how much it might cost to make a product? The easiest way is to notice that the basic manufacturing cost has 3 main elements:
The total cost is the sum of these 3 cost elements.
For different products, the importance of each contribution will vary. Note that the cost is not the same as the price - the difference is the manufacturer's profit! Here we are only interested in the manufacturing cost - the other costs are not likely to be affected much by our choice of process.
So how can we go about estimating how much it might cost to make a product? The easiest way is to notice that the basic manufacturing cost has 3 main elements:
|
 |
|
 |
|
 |
The total cost is the sum of these 3 cost elements.
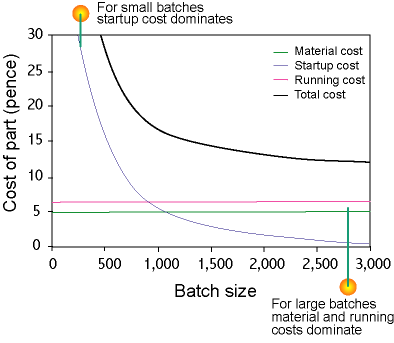
Well that's a nice curve, it shows that something will cost less if we make more, but how does it help?
Each process has a range of values for one-off costs, hourly costs and production rate - these values can be obtained from data sheets. A particular value from this range can be chosen depending on what item is to be made. Factors in this choice include component size and complexity, but choosing sensible values needs some experience.
To illustrate how this works, let's compare 2 casting processes - sand casting and die casting. We know from experience that sand casting is only used for small batches and die casting for large batches - plotting the cost curves for these 2 processes should show us why this is the case.
The data (which we have obtained from data sheets) for the manufacture of a small part by each of the casting processes looks something like this...
| DATA | Sand casting | Die casting |
| One-off cost | £100 | £2,000 |
| Hourly cost | £30/hour | £35/hr |
| Production rate | 100 parts/hour | 500 parts/hour |
From this data we can see that the running costs and startup costs must be:
| COSTS | Batch size | Running costs (= hourly cost ÷ production rate) |
Startup costs (=one-off cost ÷ batch size) |
| Sand casting: | 100 | £30/hour ÷ 100 parts/hour = 30p per part | £100 ÷ 100 parts = 100p per part |
| 100,000 | £100 ÷ 10000 parts = 1p per part | ||
| Die casting: | 100 | £35/hour ÷ 500 parts/hour = 7p per part | £2000 ÷ 100 parts = £20 per part |
| 100,000 | £2000 ÷ 10000 parts = 20p per part |
The startup cost varies with batch size, so we really need to work out the cost for each possible batch size. Let's assume that the material costs are 10p and put the whole lot together to work out the total cost...
| Process | Material cost | Running cost | Startup cost | Total cost |
|---|---|---|---|---|
| Sand casting: | 10p | 30p | £100 ÷ 100 = 100p | 140p |
| Die casting: | 10p | 7p | £2000 ÷ 100 = 2000p | 2017p |
Batch size:
Try entering different batch sizes to see how the total cost varies. At the starting batch size of 100, sand casting is cheaper than die casting. See if you can find out at approximately what batch size die casting becomes a cheaper option than sand casting.
A simpler way of dealing with this information is to plot the total cost for each process on a graph...
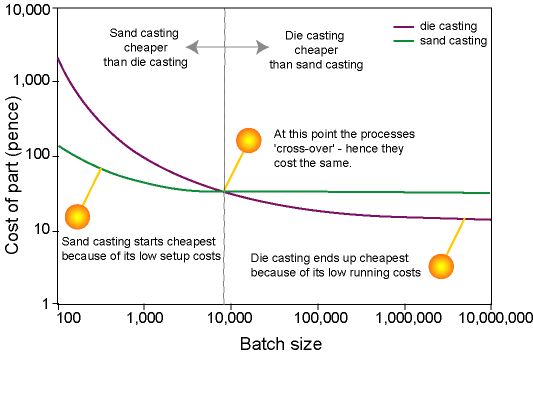
We can see immediately that:
In practice, there will usually be lots of processes to compare, and so there will be a lot of curves to draw. If this all seems like hard work, then there's some GOOD NEWS!
Most of the time we can avoid working out the costs as we have just done (although it's helpful to know how it's done!). Instead, we can use the concept of when a process is economic. We can see from the graph above that sand casting is economic for batch sizes less than 9,000 and die casting is economic for batch sizes greater than 9,000. We could say that sand casting has an economic batch size of 0 to 9,000 and die casting has an economic batch size of 9,000+.
Obviously this is only true when there are these 2 processes (sand casting and die casting), and they are manufacturing a small part. Even so, it is possible to generate a range of economic batch sizes for which a process is normally cost-effective. For instance forging has an EBS of about 10,000 components for small components and about 500 for larger components (because there are not so many competing processes for large components). So if we want to make 100,000 small components, forging is not unrealistic economically (although it is still possible another process might be even less costly).
Although these figures are not as good as the actual costs worked out long-hand, they do provide any easy method of comparing processes to see if they will be cost-effective. There's one more thing to bear in mind...
We have assumed in our costing that the manufacturer has no extra reasons for choosing a process other than simple economics. But of course, this is often not the case and factors like: