 On these charts, materials of each class (e.g. metals, polymers) form 'clusters' or 'bubbles' that are marked by the shaded regions.
We can see immediately that:
On these charts, materials of each class (e.g. metals, polymers) form 'clusters' or 'bubbles' that are marked by the shaded regions.
We can see immediately that:
We deal with the processing aspects of materials in a different part of the tutorial. For now it is sufficient to note that experienced designers aim to make the decisions for materials and processes separately together to get the best out of selection.
The choice of materials for only aesthetic reasons is not that common, but it can be important: e.g. for artists. However, the kind of information needed is difficult to obtain and we won't deal with this issue further here.
So that leaves us with performance requirements...
Most products need to satisfy some performance targets, which we determine by considering the design specification.e.g. they must be cheap, or stiff, or strong, or light, or perhaps all of these things...
Each of these performance requirements will influence which materials we should choose - if our product needs to be light we wouldn't choose lead and if it was to be stiff we wouldn't choose rubber!
So what we need is data for lots of material properties and for lots of materials. This information normally comes as tables of data and it can be a time-consuming process to sort through them. And what if we have 2 requirements - e.g. our material must be light and stiff - how can we trade-off these 2 needs?
The answer to both these problems is to use material selection charts.
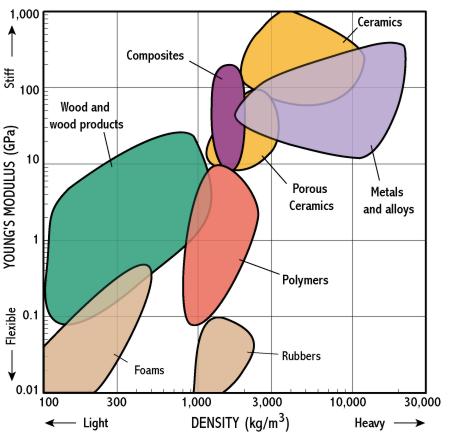
Here is a materials selection chart for 2 common properties: Young's
modulus (which describes how stiff a material is) and density.
On these charts, materials of each class (e.g. metals, polymers) form 'clusters' or 'bubbles' that are marked by the shaded regions.
We can see immediately that:
Where selection charts are really useful is in showing the trade-off between 2 properties, because the charts plot combinations of properties. For instance if we want a light and stiff material we need to choose materials near the top left corner of the chart - so composites look good.
Note that the chart has logarithmic scales - each division is a multiple of 10; material properties often cover such huge ranges that log scales are essential.
There are a selection charts for many combinations of material properties, e.g. 'strength - toughness' and 'electrical resitivity - cost'. The next section shows how we can take selection chart further...