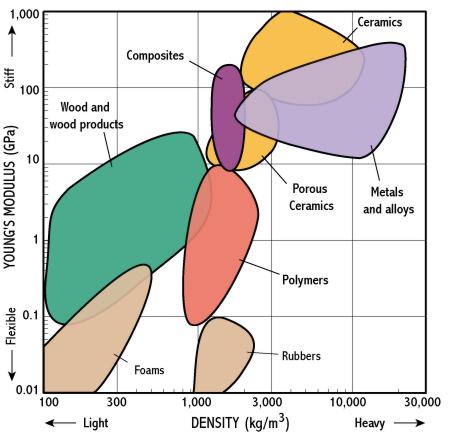
Materials selection charts are a novel graphical way of presenting material property data. Most material properties extend over several orders of magnitude, so logarithmic scales are used. Individual properties could be plotted as bar charts, but a 2D plot of a pair of properties is much better, as we will see. Figure 1 shows an example Young’s modulus against density showing where the data for the different classes of materials fall.
Figure 1: Young’s Modulus - Density Materials Selection Chart,showing the classes of materials
From this chart we can immediately see:
So, a 2-D plot enables a good visual appreciation of the ranges and relative magnitudes of the two properties considered individually, simply by spreading the materials out on the diagram, and without our having to worry too much initially about the actual values. But there’s much more to it than this. Firstly, it’s no coincidence that metals, polymers and so on cluster on a Young’s modulus - density chart. These properties reflect the characteristic atomic packing and bonding in each class, which are very well-defined. If we 'populate' the bubbles with data for material types within each class, this is even more apparent. Figure 2 shows the same chart, with the data for a selection of metals plotted.
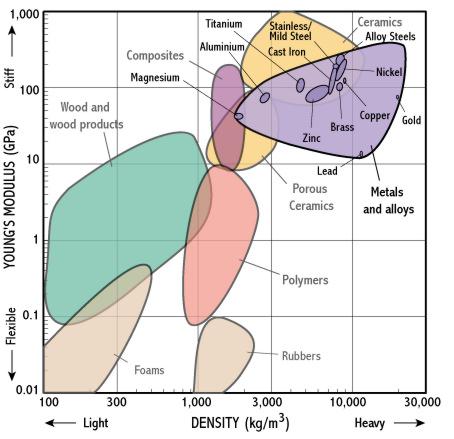
Figure 2: Young’s Modulus - Density Materials Selection Chart, showing a selection of metals
Notice that the bubbles for a type of metal or polymer (steels, or aluminium allloys, or nylon) are mostly small. The density and Young’s modulus of steel only depends on the way the iron atoms are packed, and the bonding between them - alloying or heat treatment have almost no effect. We call these 'microstructure-insensitive properties'. The spread of the data on a selection chart therefore enhances our appreciation of the underlying physics of each property.
As the name suggests, materials selection charts are also a valuable tool in engineering design. Designers have a challenging task in choosing materials for products, as they usually have to consider many competing objectives and constraints at once - light and stiff, strong and cheap, tough and recyclable (or maybe all of these at once!). Materials selection in design is therefore a matter of assessing trade-offs between several competing requirements. Traditionally designers have used extensive handbooks and their own experience to guide the choice of material in design. Selection charts provide insight into these trade-offs by pairing properties which must commonly both be considered, avoiding the need to work with tedious tables of numerical data.
As an example - what materials might we use for a light, stiff bike frame? Consider what falls towards the top left corner of Figure 1 - woods, composites, some metals, ceramics. Ceramics don’t sound very likely, but we have only considered two properties - what about strength and toughness? Figure 3 illustrates these two important properties. Note that for this chart, 'true' toughness data have been used: Gc, the strain energy release rate/unit area for unstable crack propagation. This is more universally valid and available than measures such as impact energy.
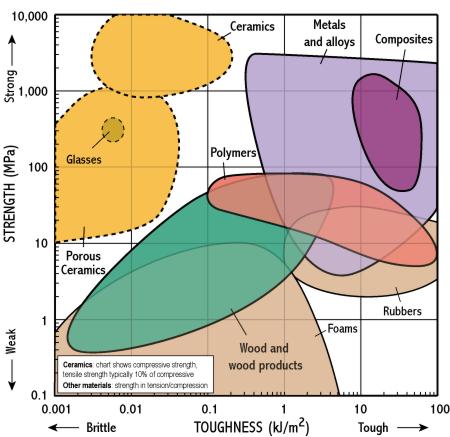
Figure 3: Strength - Toughness Materials Selection Chart,showing the classes of engineering materials.
Note that on this diagram the 'bubbles' are much bigger, as the plasticity and fracture of materials are much more sensitive to the material microstructure. In ductile materials they are controlled by plastic flow, which works by motion of defects called 'dislocations'. The motion of dislocations can be impeded by changing the microstructure (by alloying and heat treatment), which makes the material harder, but usually reduces its toughness. In brittle materials like ceramics, strength and toughness depend on the flaws which this type of material always contains. Returning to the bicycle example, we can eliminate ceramics from the list because of their low toughness. Notice also that the chart shows compressive strength for ceramics (which are high), but they are much weaker in tension.
The wider ranges of strength and toughness data are even more apparent if we populate the material classes on this selection chart too. Figure 4 shows the strength-toughness chart with a selection of metals illustrated. Note that in general the toughness of a type of alloy falls as its strength is increased, as expected.
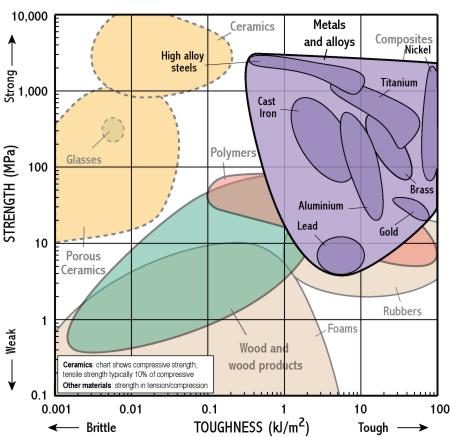
Figure 4: Strength - Toughness Materials Selection Chart, showing a selection of metals.
Designers are not only concerned with mechanical problems like stiffness and strength. Many products have electrical, thermal or optical design requirements too. Materials selection charts can help us with these properties too - and as before, the way the materials fall on a chart gives a simple appreciation of the underlying physics of, for example, electrical conduction.
Figure 5 shows the electrical resistivity, plotted against cost/kg of material. In an engineering context, material cost is almost always important, so selection charts often show this on one axis.
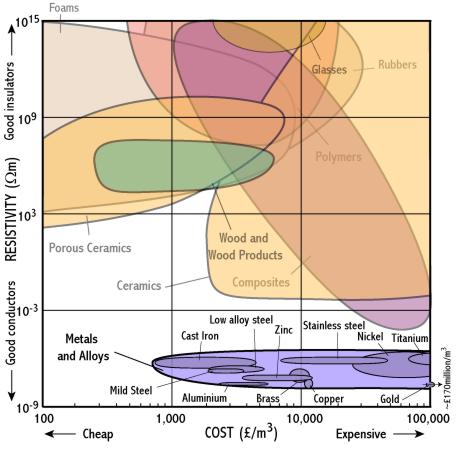
Figure 5: Electrical resistivity - Cost Materials Selection Chart, showing a selection of metals.
This chart shows that metals, which are clearly conductors, have much lower resistivity than almost all other materials. Polymers and ceramics fall at the top of the diagram, being insulators. It is worth noticing that the range of resistivity is huge - the diagram covers 24 orders of magnitude, and some insulators fall above the chart. This makes the metals look rather similar in electrical resistivity - but notice that the range across the metals is more than a factor of 1000! Clearly in selecting a conductor these are very significant differences - so the best materials are those which lie low towards the bottom of the metals bubble, such as copper and aluminium. Gold is excellent, but it is so expensive it is way off the scale of the chart. Even so, it is used for electrical contacts in microcircuits.
Finally, thermal conductivity and electrical conductivity are closely related - as the underlying physics is similar. The electrical resistivity chart also gives an indication of thermal properties - with thermal insulators towards the top (polymers and foams, and ceramics) and the good thermal conductors - metals - at the bottom. The range for thermal conductivity is also large, so metals in themselves vary quite significantly in thermal properties.