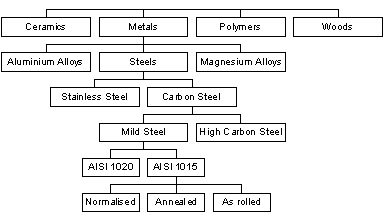
Let's say we're trying to decide how to make a rucksack frame. We need to choose a material that is stiff, light, strong and cheap – we will therefore need to find information about the Young's modulus, density, strength and cost for lots of different materials. As it is unlikely that the cheapest material will also be the lightest and stiffest, we are going to have to make some judgements to determine which is the ‘best’ choice. Since there are over 20,000 materials in common use, choosing the best one looks to be a daunting prospect! Clearly we need some way to rationalise all this information in order to simplify the selection process. Fortunately, materials may be grouped in a tree-like structure:
It is only the materials at the bottom of the tree that can actually be bought from a supplier. The entries above the bottom row are generic materials that represent the materials below them – for example, the information for ‘mild steel’ is a super-set of the information for all of the hundreds of different types of mild steel that are available. We can make life considerably easier by only choosing amongst these generic materials; it is a lot easier to decide whether ‘steels’ are better than ‘aluminium alloys’ for our rucksack frame than to choose directly between the thousands of materials that these generics represent.
So, as mild steel is not a ‘real’ material, what (for example) is its yield stress? The answer is that it will not have a single value, but it will have a range of values. This is because it must represent the yield stress for lots of different types of mild steel, each of which will have its own (different) value. For example, s y=300MPa for ‘AISI 1015 as-rolled steel’, but s y=250MPa to 400MPa for ‘mild steel’.
Selection using generic materials has the advantage of considerably reducing the amount of information we need to consider. But it also has another advantage: because we now have property ranges, if we plot a chart of one property against another, we will see ‘bubbles’ representing different materials, not points. This provides us with a visual and more intuitive way of comparing different materials; for instance in the chart of E-r below, we can quickly see that in general metals are denser than ceramics, but ceramics are stiffer than metals.
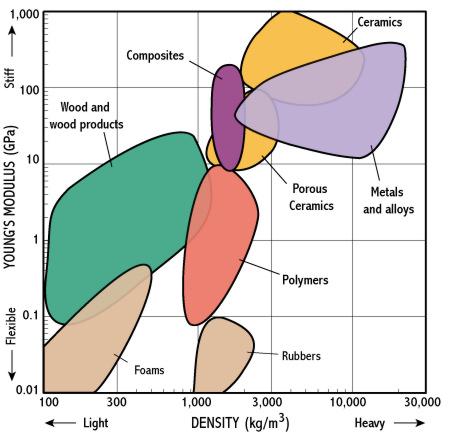
These materials selection charts provide a way of rapidly assessing lots of different materials and choosing the ones which are worth considering further. Returning to our rucksack frame example, the E-r chart above suggests that ceramics represent a good compromise between high stiffness and low density. So why don’t we use ceramics in practice? The answer is that we need to consider the rest of our requirements. If we look at a chart of strength-cost, we can see that metals can be a lot cheaper than ceramics.
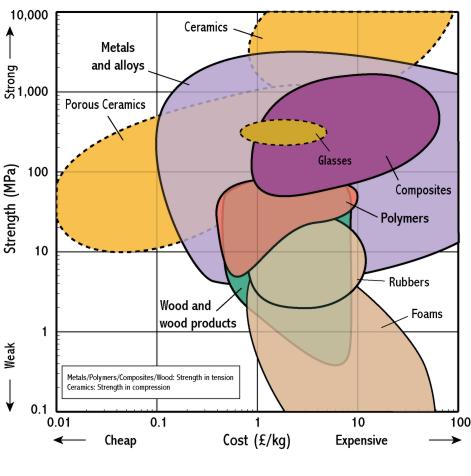
In addition, from our knowledge of strength, we know that although ceramics look as though they are stronger than metals this is only the case if we load them in compression. So maybe metals are a better choice for a rucksack frame, but which metal? We can now ‘zoom-in’ and look in more detail at the different metals.
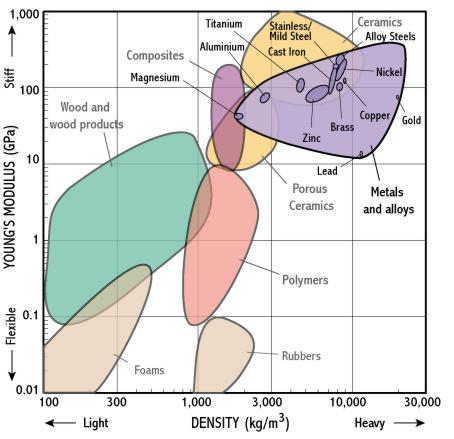
From this chart it appears that aluminium alloys might be a good choice: although they are a bit less stiff than steel, they are a lot lighter. Of course we would also want to check that the strength and cost of aluminium alloys were reasonable before we were to choose them in preference to steel, so we would also need to zoom-in on our strength-cost chart.
In theory, if we were to choose aluminium alloys, we could keep zooming-in in order to determine which particular aluminium alloy to use. However, we can see from our charts, that there is not likely to be that much difference between the various alloys and in practice it is likely to be other factors (e.g. manufacturing issues) which determine which alloy we will finally choose. When selecting materials on the basis of properties, you have to use your judgement to determine at what level of detail it is most sensible to stop.
A quick look around a sports shop shows that most rucksack frames are indeed made from aluminium, but there are also expensive ones that are made from composite materials. The charts above show why this might be: composites can be lighter, stiffer and stronger than metals – but you will have to pay more!
There is one more feature of these charts that is worth mentioning. Notice that on the charts above, the stiffer materials also tend to be the denser materials. The reason for this is that Young’s modulus and density are correlated – you can quickly see that there are no very stiff, very light materials, and there are good physical reasons for this observation. Many materials properties are correlated to some extent, and plotting selection charts often helps to reveal this; another good example is strength and toughness: generally speaking the stronger a material is, the less tough it is – again, it is no coincidence that this is the case.
Finally, there a couple of points where care needs to be taken: