Familiar everyday words when applied to people (some particularly so in the teaching profession!). Yet they are also technically important concepts in engineering and materials science. Can we convey these concepts in a convincing and interesting way?
A common university interview scenario might be: ‘What can you tell me about the elasticity of materials?’ Short pause, then out comes: “Hooke’s Law… force on a spring …(and with any luck) Young’s modulus = stress/strain, or maybe it’s the other way up?” Now the follow-up: ‘What’s the physical origin of this elastic behaviour in metals and polymers?’ or ‘What’s the importance of Young’s modulus in engineering design’. Embarrassed silence.
So, we have a problem (and not just with elasticity). Many students can trot out a definition of a materials property, or perhaps describe an experiment to measure it, but on the whole they are not very clued up about classes of engineering materials, how they ‘work’ physically, and what they’re used for. There is also a lack of precision about the distinction between concepts such as ‘stiff’, ‘strong’, and ‘tough’.
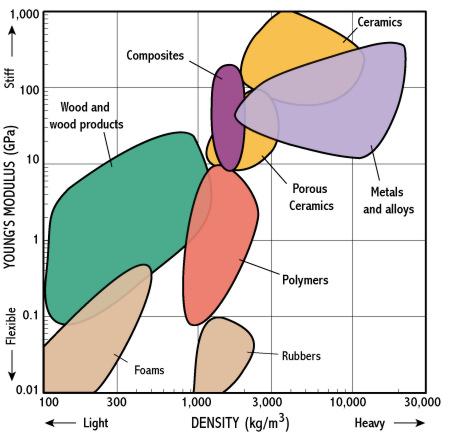
The teaching of materials in mechanical design at university level has received a recent boost by the introduction of materials selection charts, first proposed by Michael Ashby of the Cambridge University Engineering Design Centre. The key idea is to plot material property data in pairs on a chart – usually with logarithmic scales, given that most properties extend over several orders of magnitude. Figure 1 shows an example – Young’s modulus against density.

What does this tell us?
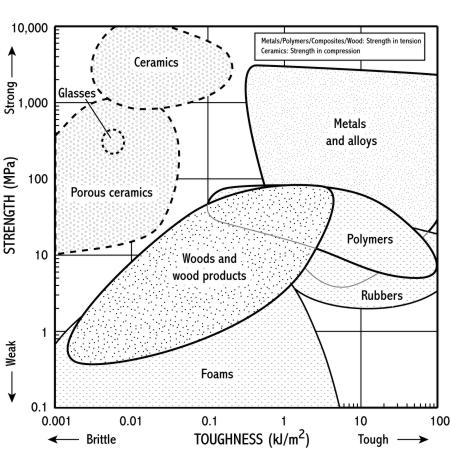
A 2-D plot enables a clear visual appreciation of the ranges of the two properties considered individually, simply by spreading the bubbles out on the diagram. But there’s much more to it than graphical clarity, both in terms of the physics of materials, and in engineering design. Of course, it’s no coincidence that metals, polymers and so on cluster on a Young’s modulus – density chart, as this reflects the characteristic atomic packing and bonding in each class. Consider two other dominant mechanical properties: yield strength and toughness, illustrated in the selection chart of Figure 2.

Now the bubbles are much bigger, as the underlying physics becomes plasticity and dislocation motion, which are influenced by all sorts of things in the material microstructure – we’ll return to this below.
A second good reason for plotting a 2D chart is because engineering design always has multiple objectives and constraints – light and stiff, strong and cheap, tough and recyclable (or maybe all of these at once!). Materials selection in design is therefore a matter of assessing trade-offs between several competing requirements. Selection charts again provide insight into these trade-offs by pairing properties which must commonly both be considered. For example – materials for a light, stiff bike frame? What falls towards the top left corner of Figure 1 – woods, composites, some metals, ceramics. Bring in charts showing strength, toughness, cost and so on, and the list can be reduced to those which do OK on all our requirements.
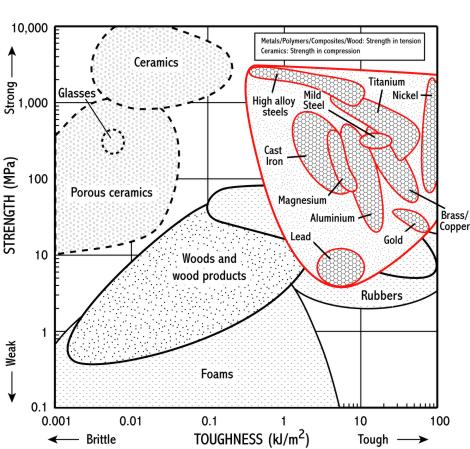
So far we’ve only looked at material classes – but the charts can of course be populated with data for the members of those classes, opening up further teaching possibilities. Figure 3 shows the strength-toughness chart, with a selection of important metals illustrated.

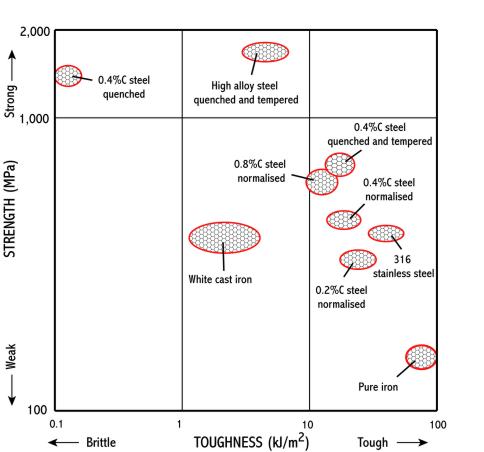
At this level, it can be seen that these properties are generally in competition – enhancing one will diminish the other. And the range of strength and toughness which can be achieved in steels is very large, so it is no surprise that steels are so ubiquitous in engineering. How is this achieved physically? Steels are iron alloyed (usually) with small amounts of carbon, plus all manner of other elements (the highest performance steels contain around 15 elements). A wide variety of thermal and mechanical processing routes (‘heat it and beat it’) in combination with alloy chemistry enables a great range of microstructures to be generated – at the level of grains, second phase particles, dislocations etc. ‘Zooming in’ on the strength-toughness chart for steels (Figure 4) illustrates the way processing and chemistry turns iron into a wide range of useful steels.

Selection charts offer a new way to convey material properties to students. They don’t tell you what stiffness, strength and toughness are – but they do provide a very visual summary of how the data for material classes (and the individual members of those classes) fall with respect to one another. This could be taken as a starting point for exploring the underlying physics of the properties, and whether they can be significantly modified by chemistry and processing. Equally they could be used to sum up after working through engineering properties in a conventional way.
For those with a stronger inclination towards the engineering aspects, the charts help to rationalise design choices. Again, they don’t tell you whether stiffness or strength (or both) are dominant in a given design problem, but do provide quick access to candidate materials once these decisions have been taken – without recourse to (tedious) tables of property data in handbooks.
Development of this approach in schools was first taken up by OCR’s Design and Technology working group, and has since been supported by the Gatsby Technology Enhancement Programme and the Engineering and Physical Sciences Research Council. Here the emphasis is on product analysis, and materials and process selection for conceptual design coursework. A CD-ROM containing selection charts, with supporting information on properties, materials and processes, will be published in autumn 1999, with a number of worked case studies exploiting the charts. Consideration will soon be given to Web-based resources.
It was recognised at an early stage that there was a good alignment between the selection charts, and the treatment of materials in the OCR/IoP ‘Advancing Physics’ course. Selection charts have therefore been incorporated – including electrical and optical properties as well as mechanical.
In both D&T and Physics, the goal is to reverse the decline in numbers of students attracted to HE and careers in materials science and engineering, and to promote academic rigour in teaching of materials. Providing both everyday and ‘big science and technology’ context for materials is key to attracting student interest. We believe that selection charts offer a route to connecting the applications of materials to the properties and underlying physics, without getting bogged down with numbers and jargon on the way.
Hugh Shercliff is Lecturer in Engineering,
Cambridge University
Andrew Lovatt is Research Associate in Engineering, Cambridge
University
Philip Withers is Professor of Materials Science, Manchester
University
This article is a draft version of a document written for inclusion in an IoP teacher booklet as part of the new A level.